Trouble debugging your Javascript in Safari? Me too! That’s why I found this little tip useful (notice I say ‘useful’ and not ‘very useful’).
Safari is usually a very large pain when building Javascript apps. There are many small issues that seem to pop up all the time. But now with the release of Safari 2.0, you have a bit of help. Safari now has a Javascript console! It’s nothing fancy, and the errors it shows are sometimes less than optimal, but it’s far better than just guessing randomly at the problem.
To enable the Javascript console, first you must enable Safari’s debug menu. Do this by opening your Terminal and inputting this line:
defaults write com.apple.Safari IncludeDebugMenu 1
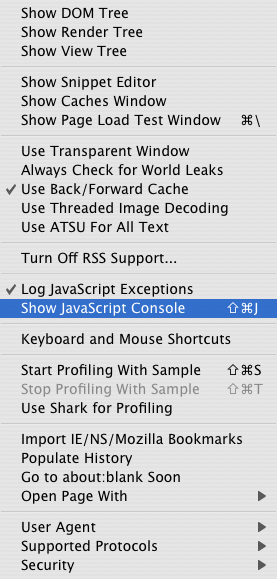
Now the next time you start Safari, you’ll have an extra menu up top called “Debug” and inside are all kinds of goodies. Here’s what the menu looks like:

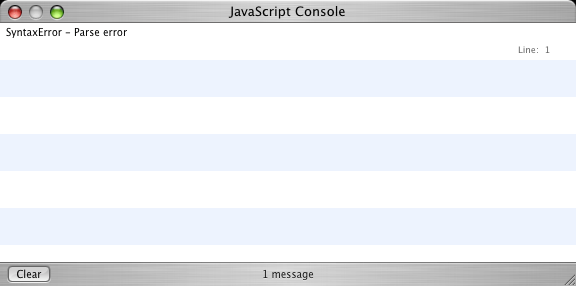
Back to the original point of this post, one of the items is “Show JavaScript Console” and selecting that item opens up this little window:

It’s not nearly as sleek and useful as the Firefox/Mozilla Javascript console, but it’s a step in the right direction, and definitely better than nothing.
That’s great! But if there are many javascript files on the page, how do you know which file the error occured in?
Is this all the javascript help I can expect from Safari?
Yeah I think you are on your own in figuring out which js file the errors come from.
If you click the link it pops open a source window and goes to the error. This should work for multiple files I would think.
Geoff, You seem to know many answers. I’m hoping you can help me on a problem my web guys don’t know how to fix: My web programers are very good with javascript on the PC. I have a site that has qtvr’s and qt’s on pages. these work on pc (IE, Firefox) and on Mac Firefox. They DO NOT work in any Mac Safari (osx 10.3.9+)!! the test web site is http://work.hostbreak.com/sws/stage…otion_33_0.html , . In Safari all we get is a big “Q” where they should play and a little “q” in the top left of the page. They are using javascript and are stumped. They have an admin to allow me to self load images and pages. That works fine for still images and qtvr/qt the problem only exists in Safari!!. Any thoughts or links to where they can go to get the right answers, they have been trying for 2 months. As you can imagine I am very frustrated, can you point us in the right direction.
Thanks.
Thanks for the tip. Maybe this was put in with one of the point updates, but my version of Safari (2.0.3) seems to display the filename just fine. [screenshot].
Found your page while looking for a solution to the problem shown in that screenshot — for some reason, I’m having trouble logging to the debug window. Here’s the javascript snippet in question:
if(window.console)
{
window.console.log( “patientViewContainerElementWidth: ” );
}
Can anyone see a problem with that? The weird part is, the example given on Apple webpage works just fine.
Whoops — figured out the problem… during a copy-paste from another file I’d inadvertently introduced an element onto my page called ‘console’ — which, needless to say, being a regular old div, doesn’t know what to do with a “log()” function call :)